If you are like us, you love data, especially when it is presented in an orderly and appealing manner – think elegant charts and graphs. Data imagery is so popular that there is even a subreddit dedicated to it (/r/dataisbeautiful/). Getting data from your home network devices and services is typically pretty easy, but it doesn’t always look good or at the very least, uniform. That is where Grafana comes in. Grafana is an open source analytics and monitoring solution that provides an interactive visualization of your data.
In this video we aren’t diving in to what all Grafana can do, though we do plan to cover some of that in future content. This video is dedicated to getting Grafana up and running quickly on a Raspberry Pi 4 Model B, including SD card preparations, OS installation, remote access via SSH configuration, and Grafana installation and service setup. Following these simple instructions can have you up and running in less than 30 minutes.
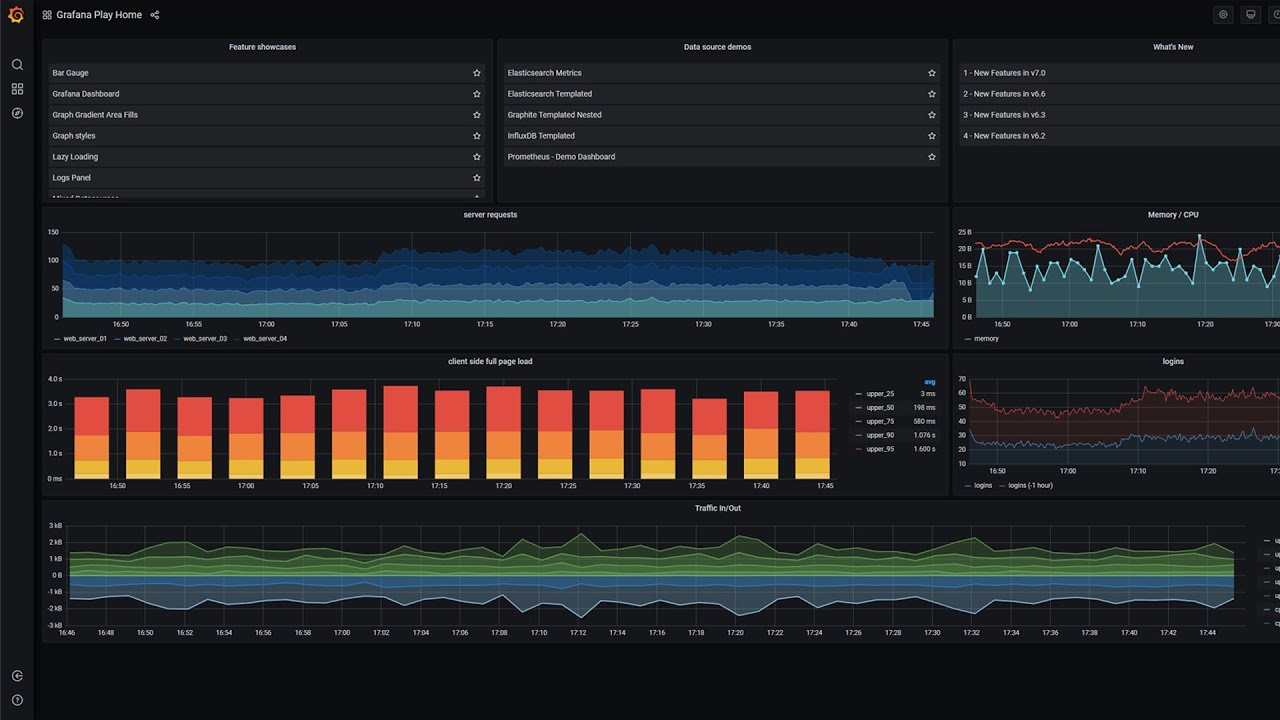
Check out the video and links below to get your own Grafana instance up and running!
Grafana Labs Installation Instructions Link:
https://grafana.com/tutorials/install-grafana-on-raspberry-pi/#1
Download Links:
Raspbian OS – https://www.raspberrypi.org/downloads/raspberry-pi-os/
Raspbian Lite Direct ZIP Link – https://downloads.raspberrypi.org/raspios_lite_armhf_latest
Raspbian Lite Torrent Link – https://downloads.raspberrypi.org/raspios_lite_armhf_latest.torrent
balenaEtcher Link – https://www.balena.io/etcher/
Amazon Affiliate Links:
Raspberry Pi 4 Model B (4GB version)
32GB SanDisk Micro SD Card