Last Updated: February 2026
All tool descriptions, regulatory references, and methodology summaries verified against official publications as of publication date.
Note: Coverage maps and performance dashboards update frequently. Always verify current data directly from the official platform before making network decisions.
Checking 5G coverage before switching carriers, upgrading a device, or installing fixed wireless access is essential in 2026. 5G performance depends on spectrum band (low-band, mid-band, or mmWave), population density, tower placement, and network load. A single coverage map rarely tells the full story because some tools rely on predictive propagation models, while others depend on real-world user measurements.
According to GSMA Intelligence, global 5G connections surpassed 1.5 billion by the end of 2023, with continued expansion into 2025. However, the International Telecommunication Union notes that broadband access remains uneven between urban and rural regions. These differences make it important to compare multiple data sources before concluding that coverage equals performance.
This guide evaluates seven widely recognized 5G coverage tools based on data source transparency, update frequency, granularity level, regulatory alignment, and suitability for different users. The goal is not to declare one universal winner, but to help you understand which tool is best for your specific decision-making context.
Quick Summary
Best Official Eligibility Check: Carrier Coverage Maps
Best Real-World Experience Data: Opensignal
Best Performance Benchmarking: Ookla Speedtest Map
Best Regulatory Transparency: National Telecom Regulator Maps
Best Technical Band Identification: CellMapper
Best Global Traveler View: nPerf
Best Market-Level Analysis: GSMA Intelligence Data
Comparison Table (Verified February 2026)
| Tool | Primary Data Source | Granularity | Best For | Update Model | Limitation |
| Carrier Coverage Maps | Predictive modeling (provider-submitted) | Address/Postcode | Plan eligibility | Network rollout updates | Theoretical coverage |
| Opensignal | Crowdsourced real-user measurements | City/Regional | Experience insights | Continuous aggregation | Sparse rural data |
| Ookla 5G Map | Speedtest Intelligence | City-level | Performance comparison | Quarterly reporting | User-initiated tests |
| Regulator Maps | Mandated compliance filings | National grid | Policy verification | Scheduled reporting cycles | May lag live rollout |
| CellMapper | Community tower mapping | Tower-level | Band & sector analysis | User contributions | Technical interface |
| nPerf | Crowdsourced tests | Regional/Global | Travel comparison | Continuous updates | Density varies by region |
| GSMA Intelligence | Industry analytics | Country-level | Market research | Annual/periodic reports | Not address-specific |
How to Choose the Right 5G Coverage Tool
- Understand the Data Source
Carrier coverage maps are typically based on standardized propagation modeling parameters submitted by operators. These maps estimate signal reach under defined assumptions. Crowdsourced platforms collect real-world user device measurements, which reflect practical experience but depend on participation density. - Identify the Frequency Band
5G operates on low-band, mid-band, and millimeter wave frequencies. Mid-band generally balances speed and coverage. Millimeter wave provides very high throughput but shorter range and reduced indoor penetration. If a tool does not specify band layers, it may not provide full context. - Separate Availability from Performance
Coverage means signal presence. Performance refers to actual download speed, upload speed, and latency under load. Median speeds reported by benchmarking tools reflect aggregate measurements, not guaranteed throughput. - Check Update Transparency
Tools that publish update cycles or reporting intervals improve accountability. Regulatory maps often follow mandated reporting timelines, while crowdsourced tools update continuously. - Match Tool to Decision Context
If you are verifying plan eligibility, use official carrier portals. If comparing network experience in a city, consult crowdsourced performance dashboards. If analyzing national rollout trends, industry analytics may be more relevant.
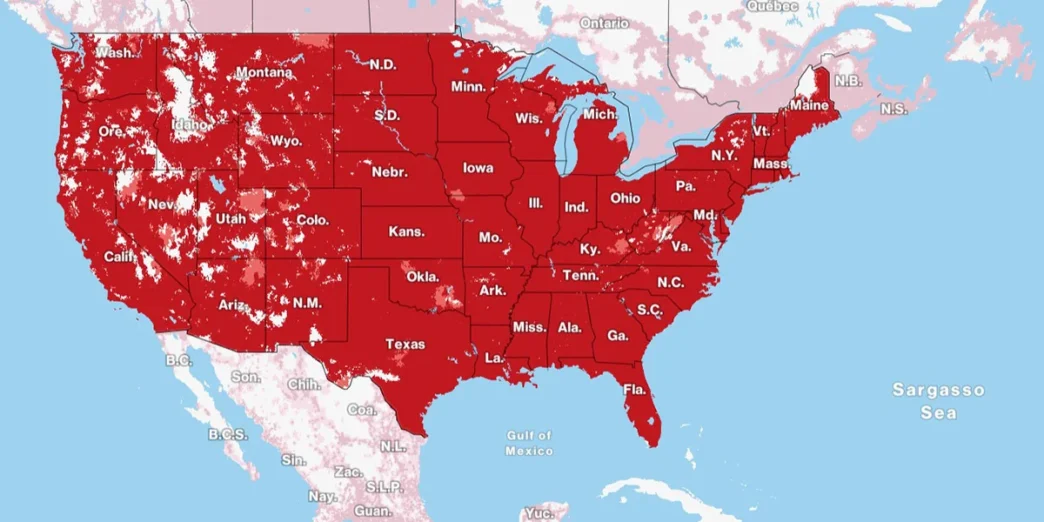
1. Carrier Coverage Maps
Official carrier portals provide address-level eligibility verification. These maps are typically built from predictive propagation modeling based on licensed spectrum and tower deployment data. Regulators such as the FCC require standardized broadband availability reporting formats. Similar frameworks exist in other countries through national communications authorities.
Best For: Confirming whether a specific postcode qualifies for a 5G plan.
Strength: Required for final service activation.
Limitation: May reflect modeled coverage rather than live congestion performance.
2. Opensignal
Opensignal publishes experience-based insights derived from billions of device measurements. Its reports evaluate 5G availability, download experience, and latency based on aggregated user data.
Best For: Comparing real-world user experience across operators.
Strength: Reflects measured performance rather than theoretical reach.
Limitation: Lower measurement density in rural regions.
3. Ookla Speedtest Map
Ookla’s Speedtest Intelligence aggregates user-initiated speed tests to produce city-level and national performance comparisons. Reports often include median download speeds and network consistency metrics.
Best For: Evaluating comparative performance across cities.
Strength: Widely recognized benchmarking methodology.
Limitation: Dependent on active test participation.
4. National Telecom Regulator Maps
Regulatory broadband maps compile standardized operator filings. These datasets improve transparency by applying consistent reporting criteria across carriers.
Best For: Policy review and compliance transparency.
Strength: Government oversight framework.
Limitation: Reporting intervals may not match real-time deployments.
5. CellMapper
CellMapper allows users to identify individual 5G NR bands and tower sectors. It is particularly useful for advanced users analyzing band aggregation and sector orientation.
Best For: Technical users and engineers.
Strength: Tower-level detail.
Limitation: Interface complexity for beginners.
6. nPerf
nPerf provides global coverage visualization and comparative operator metrics based on user-submitted tests. Its international focus makes it useful for travelers comparing networks across countries.
Best For: Cross-border comparisons.
Strength: Multi-country view.
Limitation: Data density varies by market.
7. GSMA Intelligence
GSMA Intelligence publishes industry-level adoption and population coverage statistics. While not address-specific, it provides macro-level insights into 5G deployment trends and spectrum expansion.
Best For: Market research and high-level analysis.
Strength: Industry-standard analytics.
Limitation: Not designed for individual eligibility checks.
Best for Specific Use Cases
Beginners: Carrier coverage maps provide the simplest method to verify plan eligibility.
Travelers: nPerf allows cross-country comparison of operator performance.
Technical Users: CellMapper reveals specific frequency bands and tower sectors.
Data-Driven Decisions: Opensignal and Ookla provide measured experience metrics.
Policy Review: Regulator maps offer standardized compliance-based datasets.
Market Analysts: GSMA Intelligence supplies macro-level adoption trends.
Frequently Asked Questions
Is coverage the same as speed?
No. Coverage indicates signal presence. Speed depends on band allocation, network load, and device capability.
How often should I check 5G coverage?
Quarterly reviews are reasonable in fast-growing markets, especially where new spectrum bands are being deployed.
Do all 5G networks use the same frequencies?
No. Low-band covers wider areas with lower peak speed, mid-band balances speed and range, and millimeter wave delivers high throughput over shorter distances.
Why combine multiple tools?
Combining official eligibility maps with independent measurement platforms reduces reliance on a single data model.
Final Recommendation
In 2026, no single 5G coverage tool provides a complete picture. Carrier portals confirm eligibility, crowdsourced platforms reveal performance experience, regulatory datasets enhance transparency, and industry analytics track long-term rollout trends.
Before changing plans or investing in 5G hardware, compare at least two independent sources. Coverage claims should always be interpreted alongside frequency band, device compatibility, and congestion context. Using a layered approach ensures more reliable network decisions.