


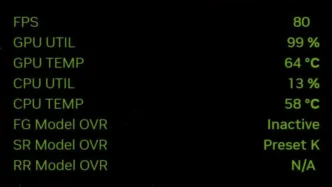
NVIDIA has expanded its in-game Statistics overlay with three long-requested CPU metrics. Version 11.0.9 of the NVIDIA App can now display processor temperature, clock speed, and power consumption alongside existing GPU, frame-rate, and DLSS information, giving GeForce users more performance data without requiring a second monitoring utility.
Key takeaways
- NVIDIA App version 11.0.9 adds CPU temperature, clock speed, and power monitoring.
- The metrics are available through the overlay’s Custom Statistics view.
- CPU temperature is shown as one overall reading rather than per-core data.
- System RAM and VRAM usage remain unavailable in the overlay.
- The update was not clearly listed in NVIDIA’s official 11.0.9 release notes.
New CPU metrics arrive in the NVIDIA App
The update fills one of the more visible gaps in NVIDIA’s built-in performance overlay. GeForce owners can now monitor processor thermals and operating behavior while gaming, rather than opening HWiNFO, MSI Afterburner, RTSS, or NVIDIA’s separate FrameView utility.
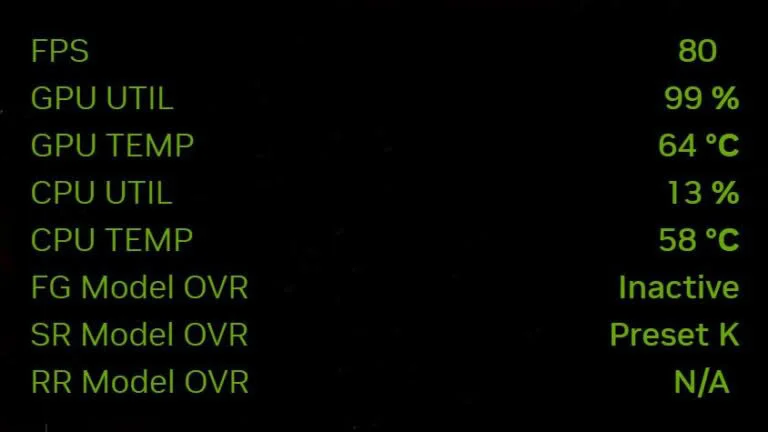
The new information can be displayed alongside FPS, GPU utilization, GPU temperature, and DLSS details. That combination should be useful for identifying CPU-limited scenarios, checking thermal behavior, and confirming whether a system is maintaining expected clock speeds during demanding games.
How to enable the monitoring options
Users can access the new metrics through the NVIDIA App with the following steps:
- Press Alt + Z to open the NVIDIA overlay.
- Select Statistics at the bottom of the interface.
- Switch to the Custom view.
- Enable the statistics overlay with Alt + R.
- Select CPU temperature, clock speed, power, and any other desired metrics.
The overlay also supports adjustable font size and color, as well as horizontal and vertically stacked layouts. These options allow users to fit a larger number of readings on screen without covering as much game content.
Useful, but not a complete monitoring replacement
Although the update improves the NVIDIA App’s usefulness for everyday gaming, it does not match the depth of dedicated monitoring tools. CPU temperature is currently presented as a single processor reading, with no per-core temperature breakdown. CPU utilization also remains less detailed than what enthusiast-oriented utilities can provide.
System RAM and VRAM usage are additional omissions. A frame-time graph would also make the overlay more useful for diagnosing stutter and uneven frame delivery. Users who need those measurements will still need software such as RTSS, HWiNFO, or MSI Afterburner.
A quiet addition to version 11.0.9
The CPU monitoring features were reportedly not highlighted in NVIDIA’s official version 11.0.9 release notes, which focused on changes including DLSS 4.5 Ray Reconstruction, per-application Resizable BAR controls, and interface updates. The options instead drew attention after users noticed them in the updated application.
For ThinkComputers readers building or tuning gaming PCs, the change is a practical improvement rather than a major overhaul. It reduces the need for multiple overlays while adding the CPU information most useful for quick thermal and performance checks. NVIDIA still has room to expand the feature, particularly with memory usage and more granular processor statistics.
Via Digital Foundry