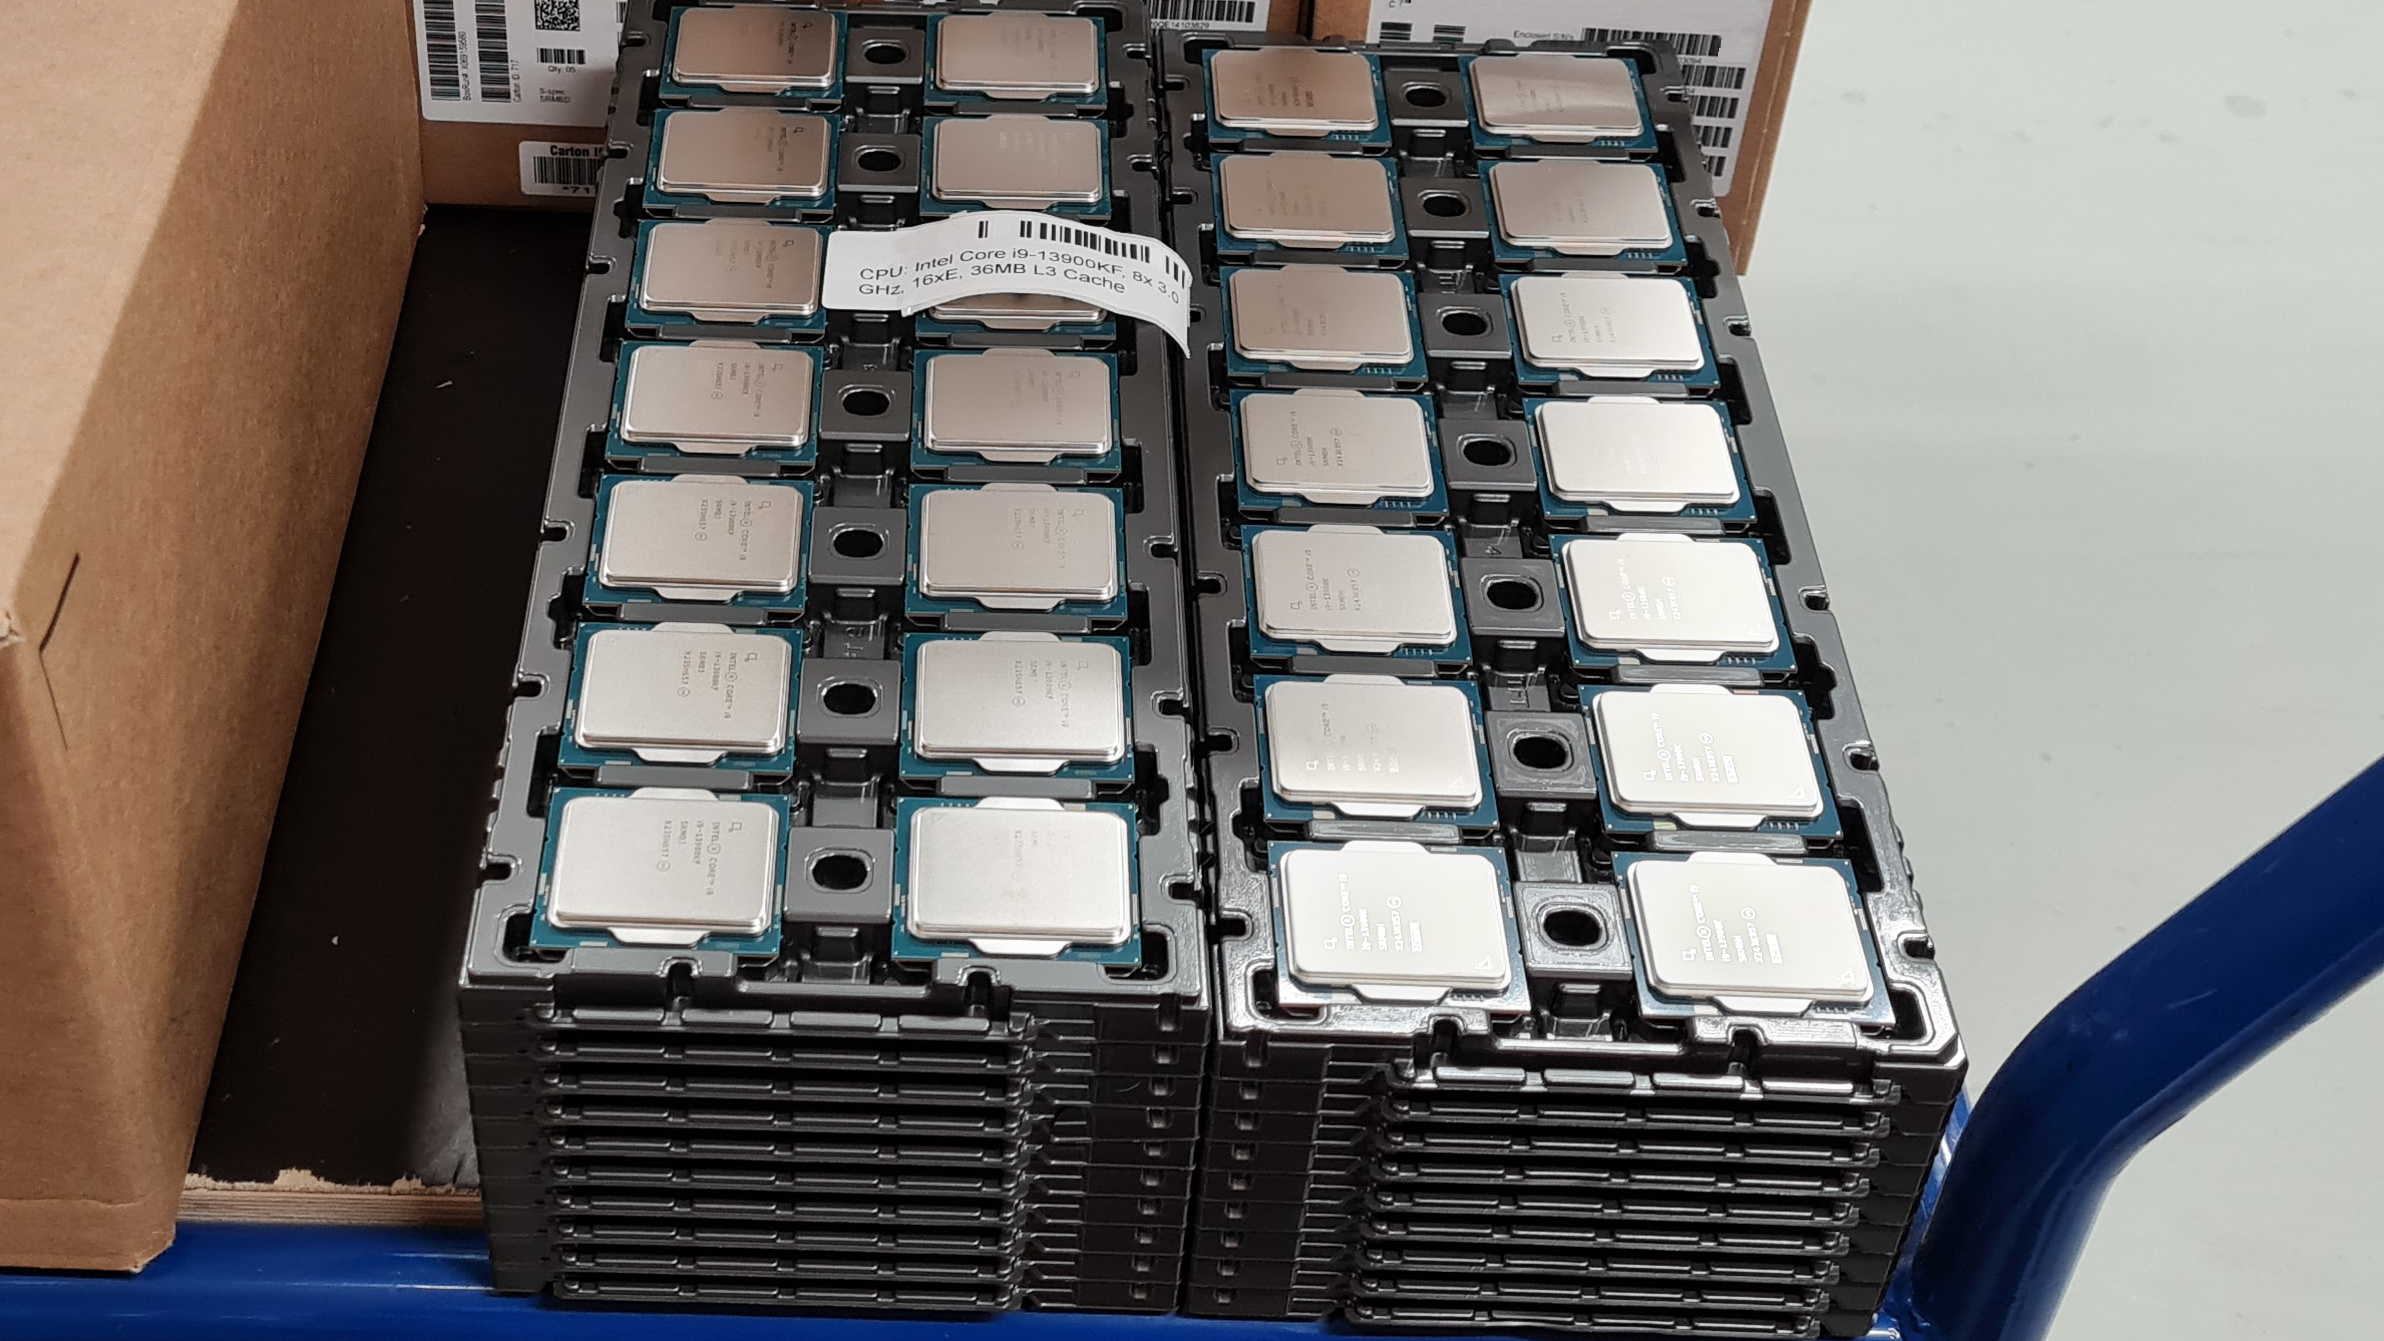
For testing purposes, 199 Intel Core i9-13900KS CPUs were made available to Igor’sLAB’s Xaver Amberger and his friends. This allowed them to provide the final portion of their research on large-scale binning for Intel Core K-series CPUs. The KS is a Special Edition variant having a factory-installed clock speed of up to 6.0 GHz. Intel has clearly been reserving 13900K processors for this special edition, as prior binning reports demonstrate. Igor’sLAB states that the voltage/frequency curve of all Core i9-13900KS processors cannot exceed 1.49 GHz @ 6.0 GHz. This implies that if the voltage necessary to achieve this frequency is greater, the chip will no longer be a KS but a Core i9-13900K.
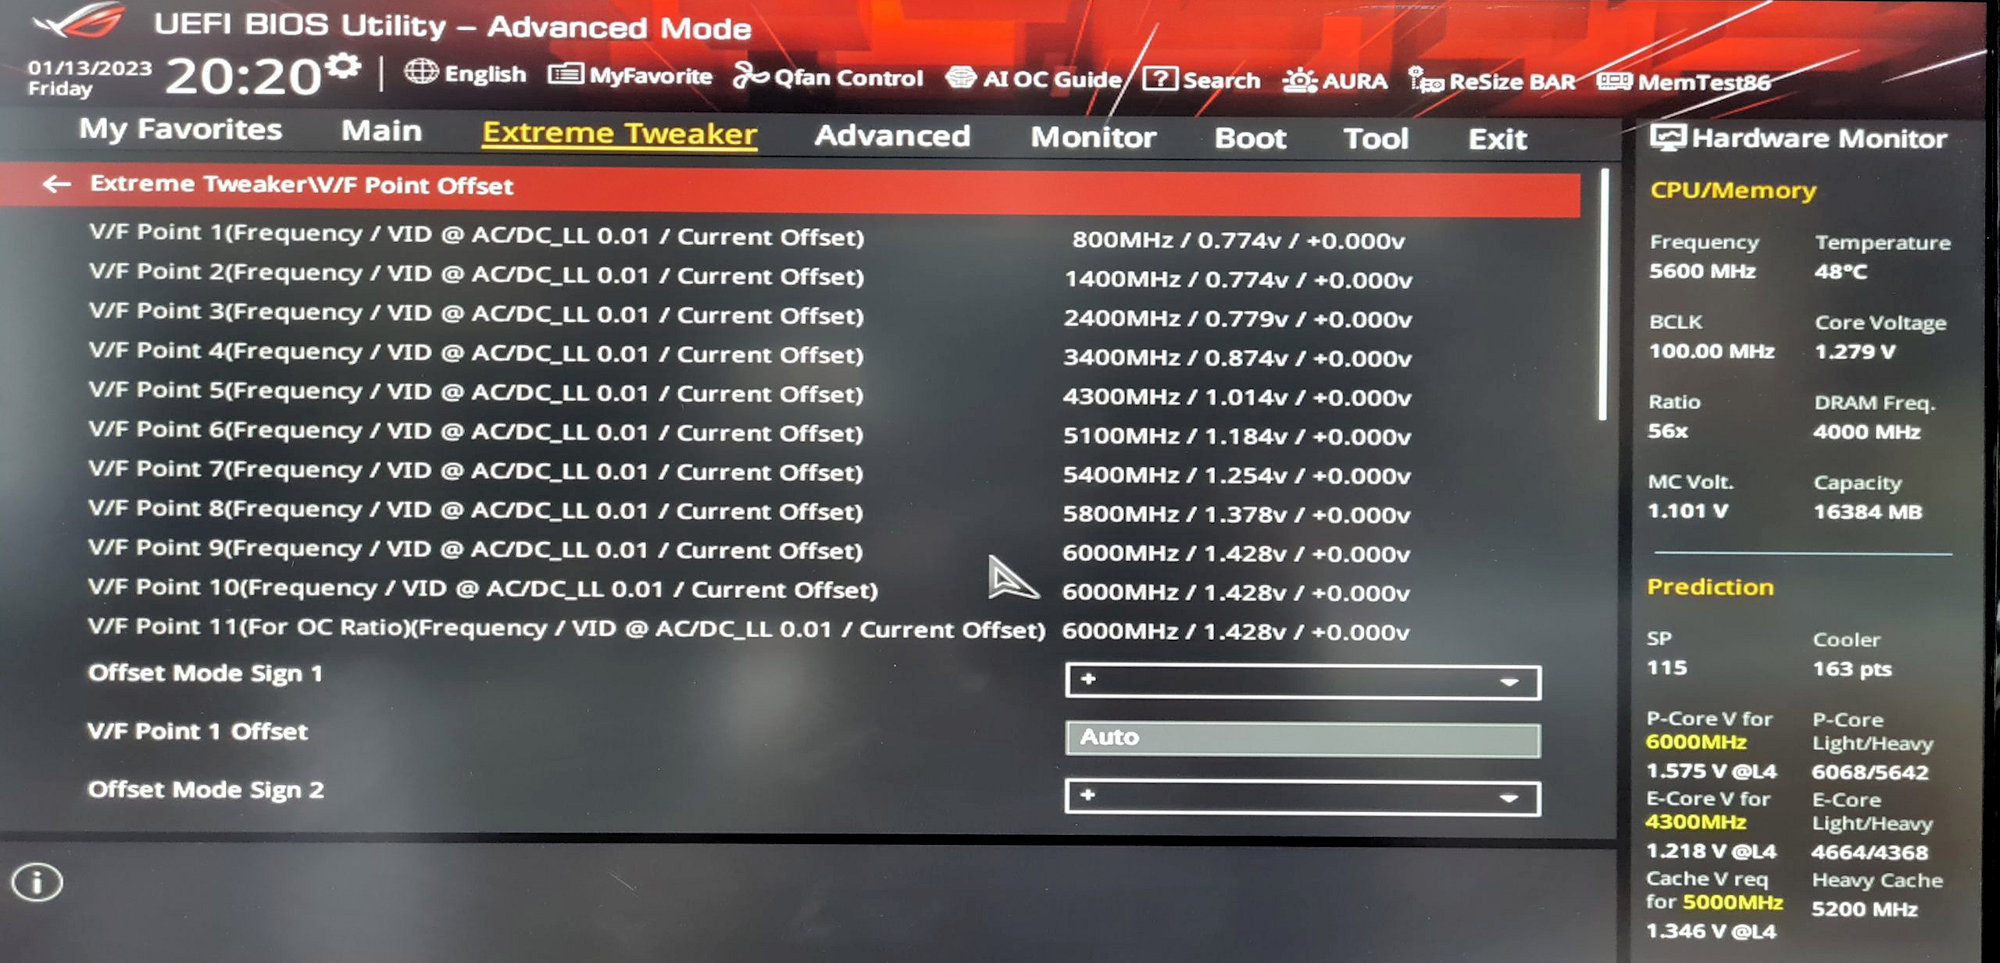
Importantly, the KS variations are merely prebinned versions of the 13900K and not the 13900KF, as the 6.0 GHz SKU features integrated graphics. Technically, a consumer has a larger possibility of discovering a Core i9-13900KF CPU with an identical V/F curve to the KS model, but Intel would not use this chip for the KS. The Silicon Prediction numbers are derived from the ASUS methodology employed in LGA1700 motherboards. It is not an official number, nor can it be equated to other SKUs. This deterministic approach of assigning simple values to V/F curves facilitates comparison, but only across identical chips.
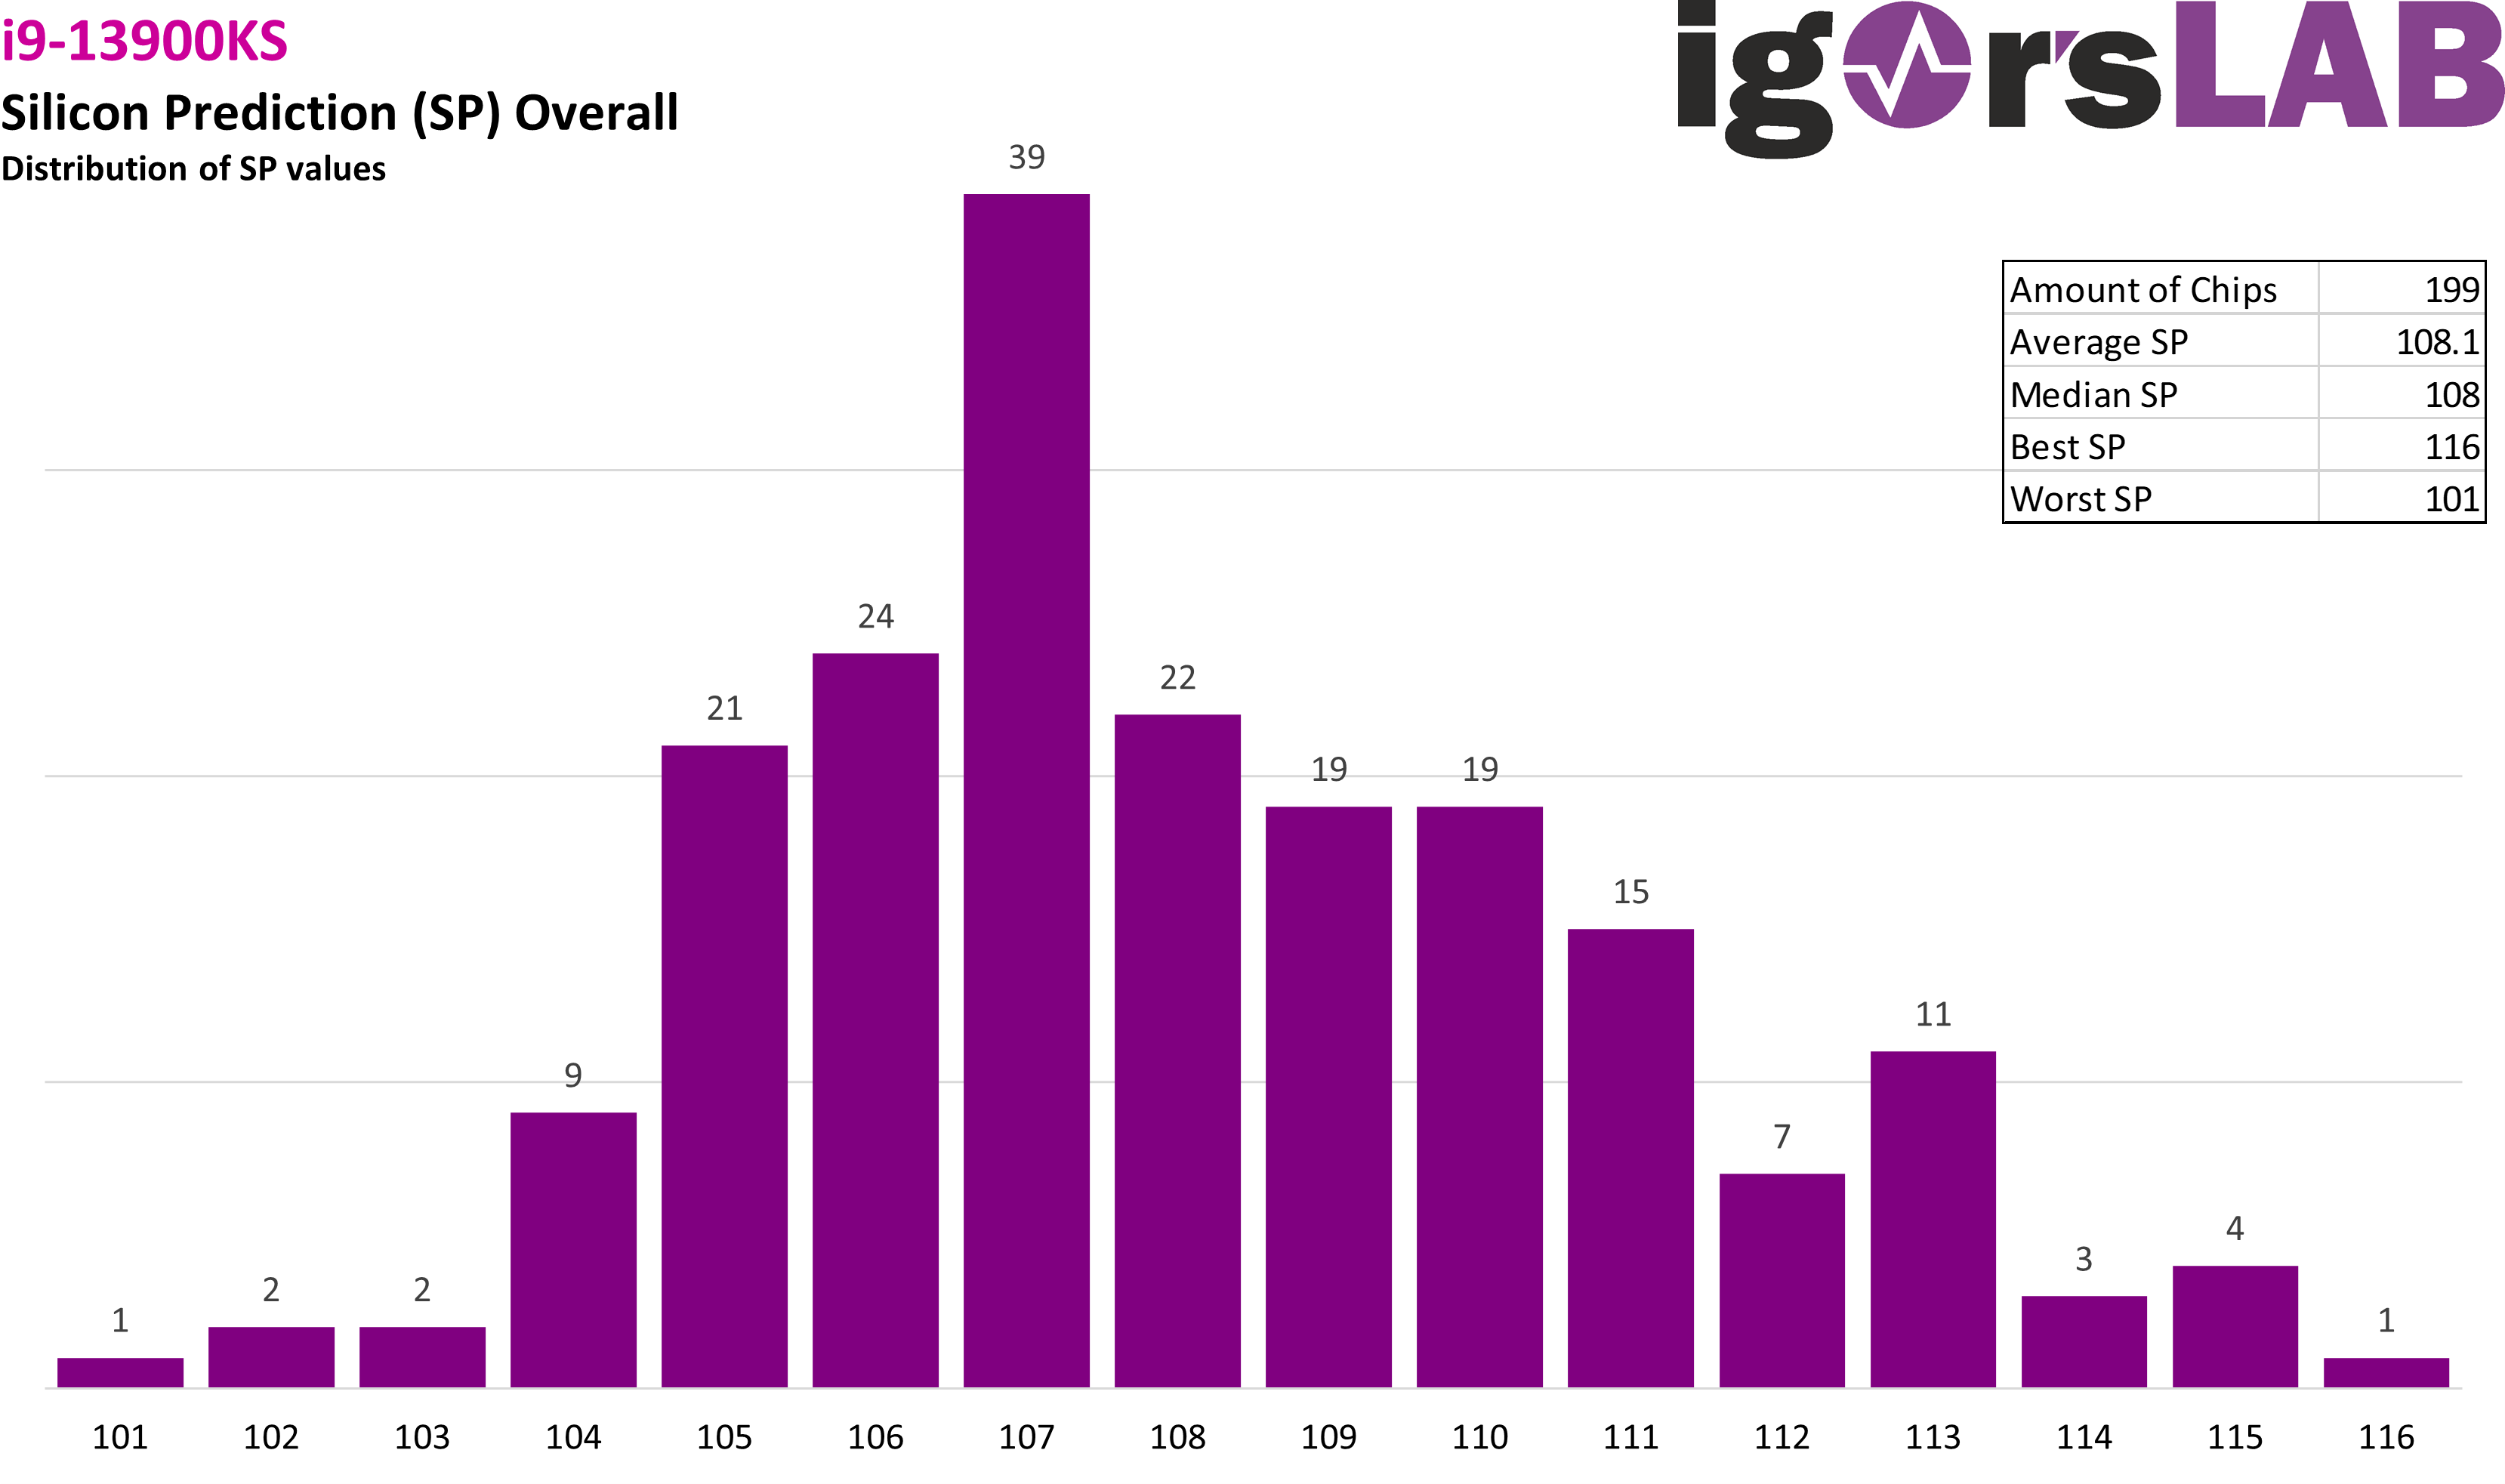
The average SP score for 199 evaluated CPUs was 108.1 points. However, the SP score distribution for Performance and Efficient cores was distinct, with an average of 117.5 and 90.4 for each kind of core. Xaver observes that the Efficient SP score distribution shifts to the right, showing that Intel is also considering the smaller cores, even though the CPU uses the same E-core frequencies as the 13900K SKU.
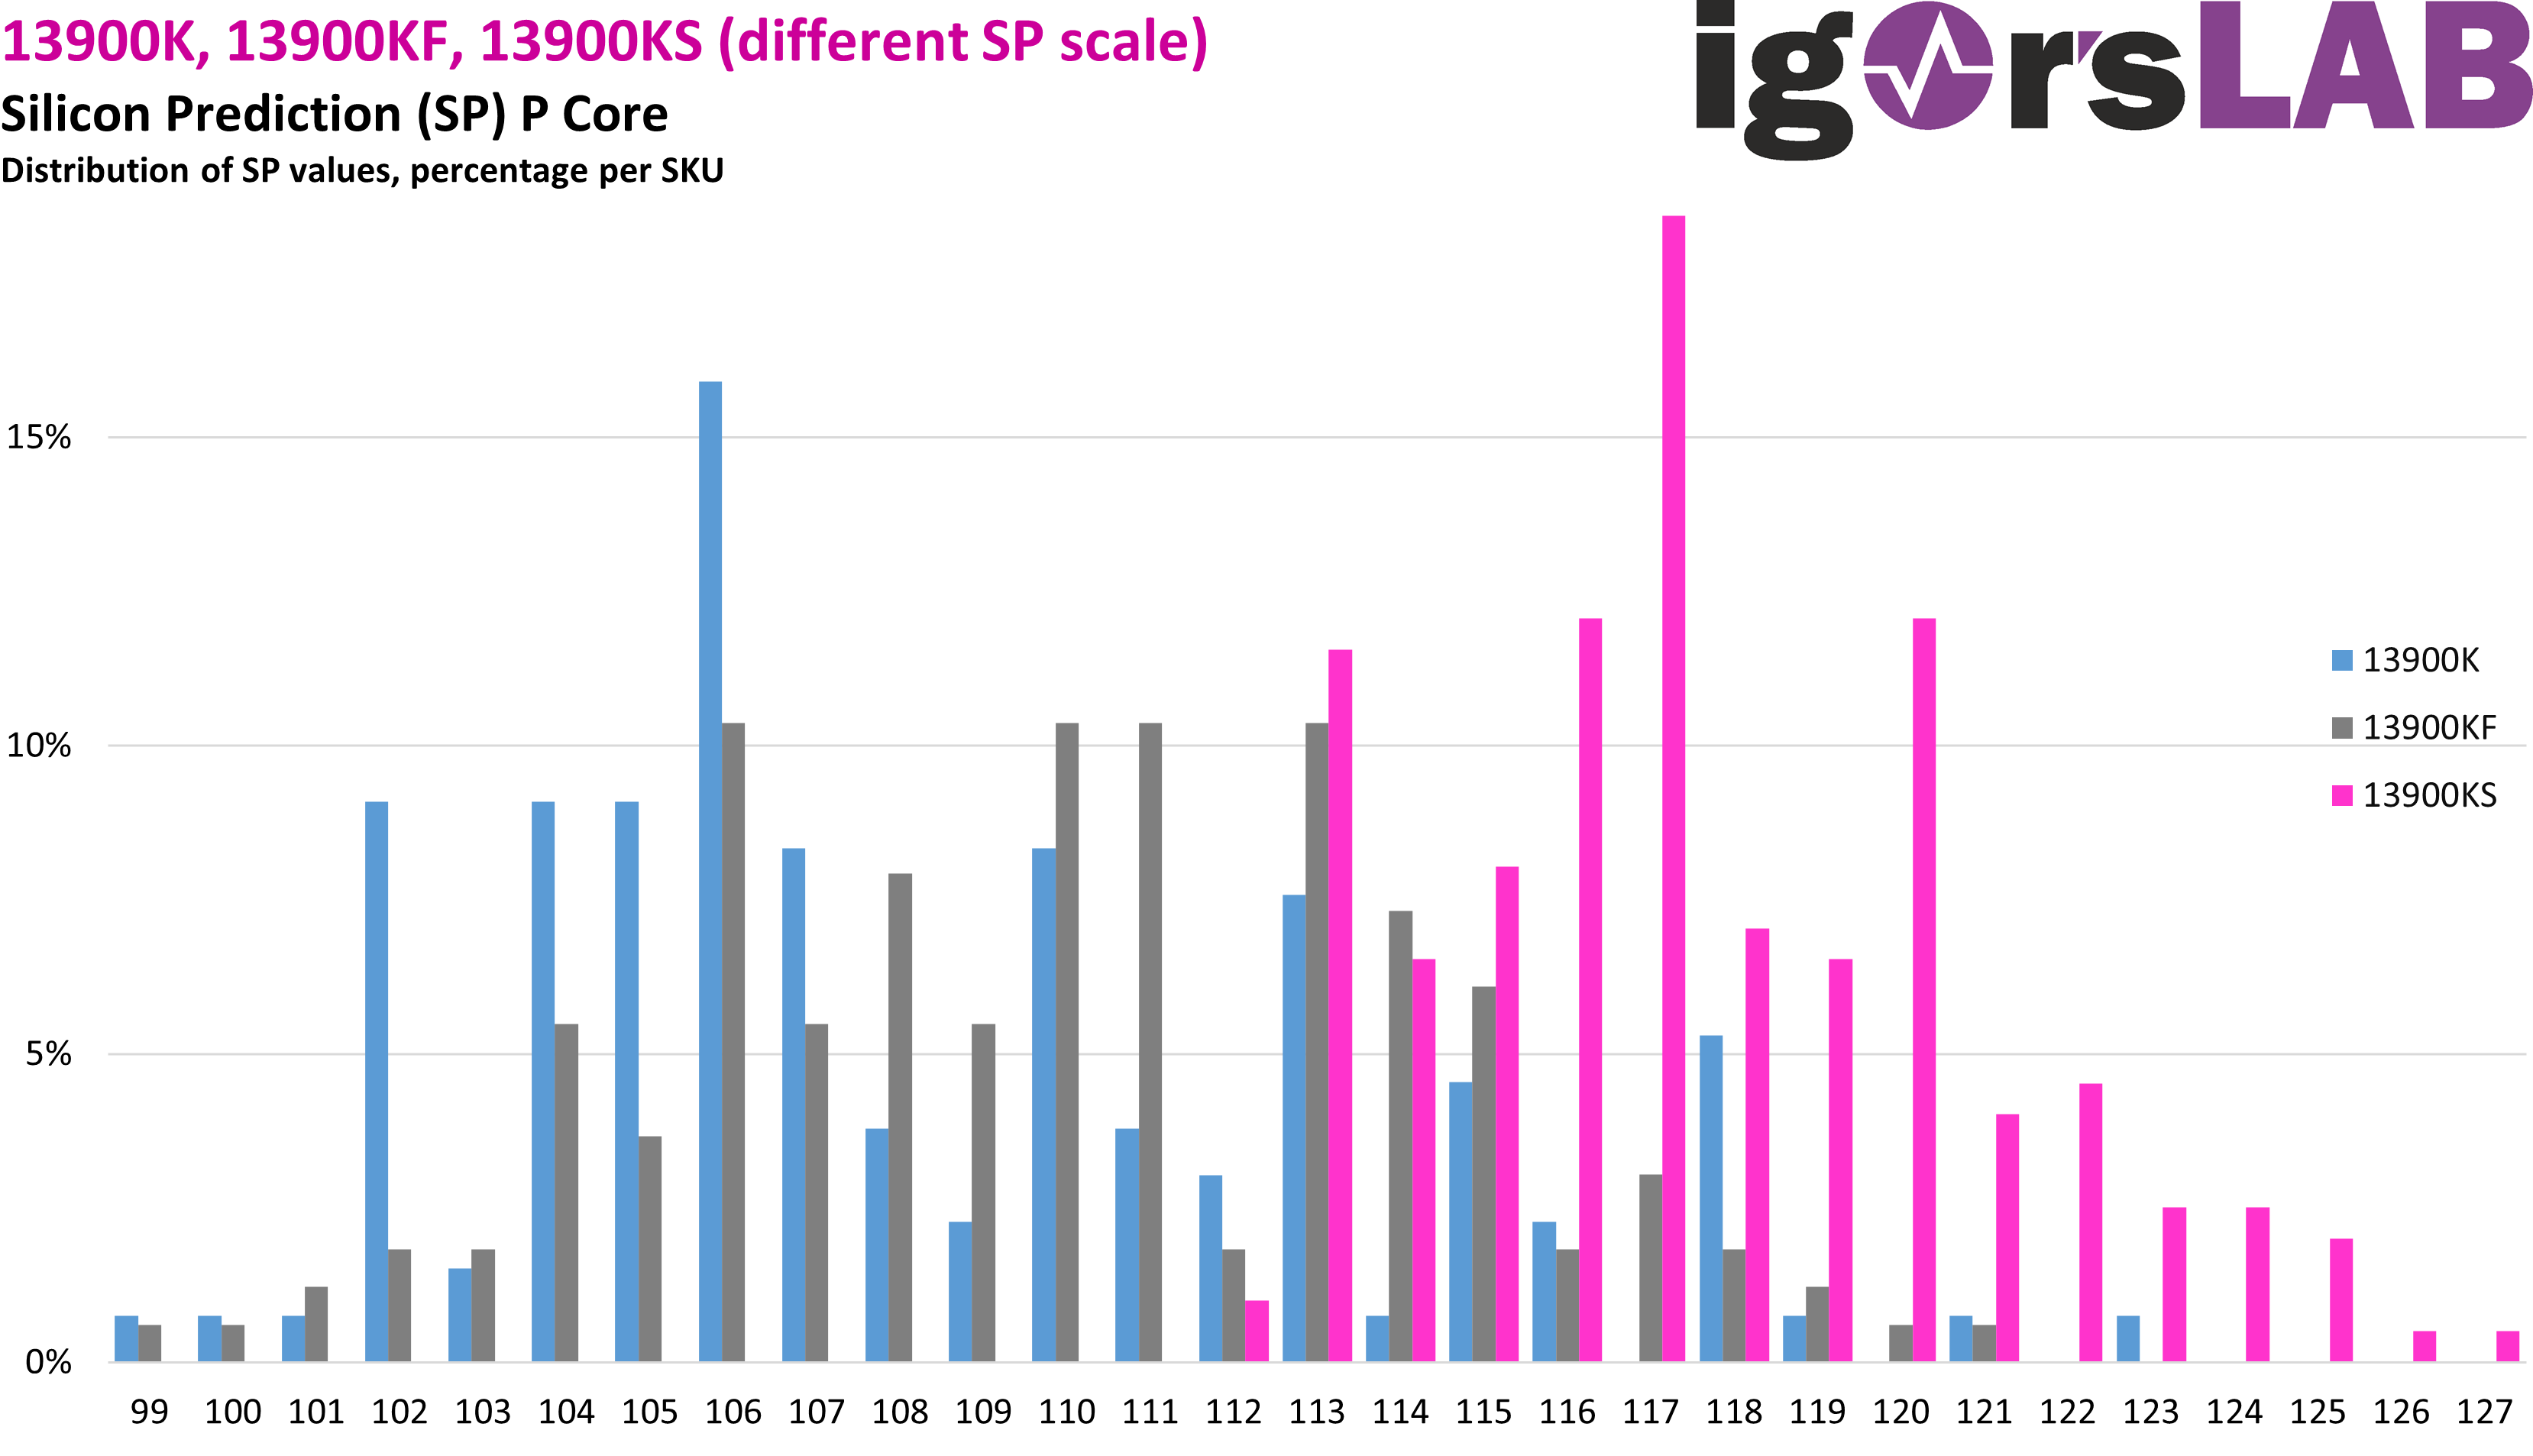
The graph illustrates the SP scores of the Core i9-13900K/13900KF and 13900KS SKUs. Again, the SP numbers for each SKU are not displayed on the same scale. Consequently, the graph just displays the distribution model, which obviously leans to the right for the KS variation. While it would make more sense to compare voltage/frequencies, doing so for such a huge number of CPUs would likely take days, if not weeks. The original research also examines memory controllers and their correlation with ASUS-reported SP levels. While a higher SP score does not ensure compatibility for 8 Gbps RAM, it does indicate no statistical relevance.
Via Igor’s Lab