As of March 31, 2019, Backblaze had 106,238 spinning hard drives in our cloud storage ecosystem spread across three data centers. Of that number, there were 1,913 boot drives and 104,325 data drives. This review looks at the Q1 2019 and lifetime hard drive failure rates of the data drive models currently in operation in our data centers and provides a handful of insights and observations along the way.
Hard Drive Failure Stats for Q1 2019
At the end of Q1 2019, Backblaze was using 104,325 hard drives to store data. For our evaluation we remove from consideration those drives that were used for testing purposes and those drive models for which we did not have at least 45 drives (see why below). This leaves us with 104,130 hard drives. The table below covers what happened in Q1 2019.

Notes and Observations
If a drive model has a failure rate of 0%, it means there were no drive failures of that model during Q1 2019. The two drives listed with zero failures in Q1 were the 4 TB and 5 TB Toshiba models. Neither has a large enough number of drive days to be statistically significant, but in the case of the 5 TB model, you have to go back to Q2 2016 to find the last drive failure we had of that model.
There were 195 drives (104,325 minus 104,130) that were not included in the list above because they were used as testing drives or we did not have at least 45 of a given drive model. We use 45 drives of the same model as the minimum number when we report quarterly, yearly, and lifetime drive statistics. The use of 45 drives is historical in nature as that was the number of drives in our original Storage Pods. Beginning next quarter that threshold will change; we’ll get to that shortly.
The Annualized Failure Rate (AFR) for Q1 is 1.56%. That’s as high as the quarterly rate has been since Q4 2017 and its part of an overall upward trend we’ve seen in the quarterly failure rates over the last few quarters. Let’s take a closer look.
Quarterly Trends
We noted in previous reports that using the quarterly reports is useful in spotting trends about a particular drive or even a manufacturer. Still, you need to have enough data (drive count and drive days) in each observed period (quarter) to make any analysis valid. To that end the chart below uses quarterly data from Seagate and HGST drives while leaving out Toshiba and WDC drives as we don’t have enough drives from those manufacturers over the course of the last three years.
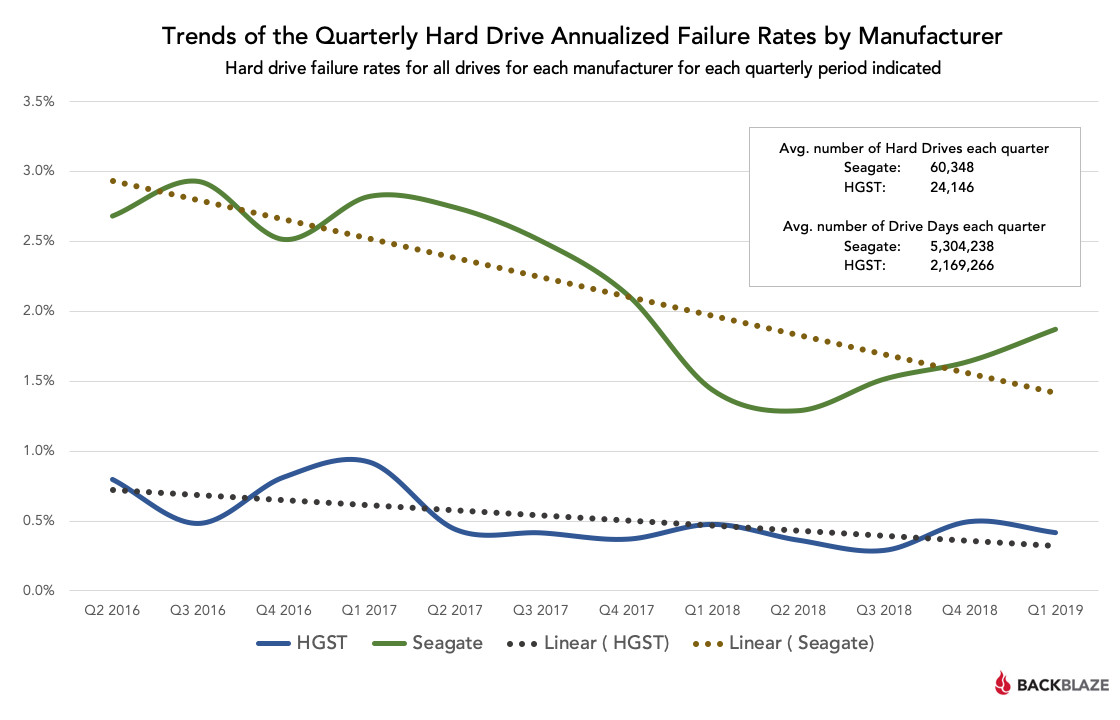
Over the last three years, the trend for both Seagate and HGST annualized failure rates had improved, i.e. gone down. While Seagate has reduced their failure rate over 50% during that time, the upward trend over the last three quarters requires some consideration. We’ll take a look at this and let you know if we find anything interesting in a future post.
Changing the Qualification Threshold
As reported over the last several quarters, we’ve been migrating from lower density drives, 2, 3, and 4 TB drives, to larger 10, 12, and 14 TB hard drives. At the same time, we have been replacing our stand-alone 45-drive Storage Pods with 60-drive Storage Pods arranged into the Backblaze Vault configuration of 20 Storage Pods per vault. In Q1, the last stand-alone 45-drive Storage Pod was retired. Therefore, using 45 drives as the threshold for qualification to our quarterly report seems antiquated. This is a good time to switch to using Drive Days as the qualification criteria. In reviewing our data, we have decided to use 5,000 Drive Days as the threshold going forward. The exception, any current drives we are reporting, such as the Toshiba 5 TB model with about 4,000 hours each quarter, will continue to be included in our Hard Drive Stats reports.
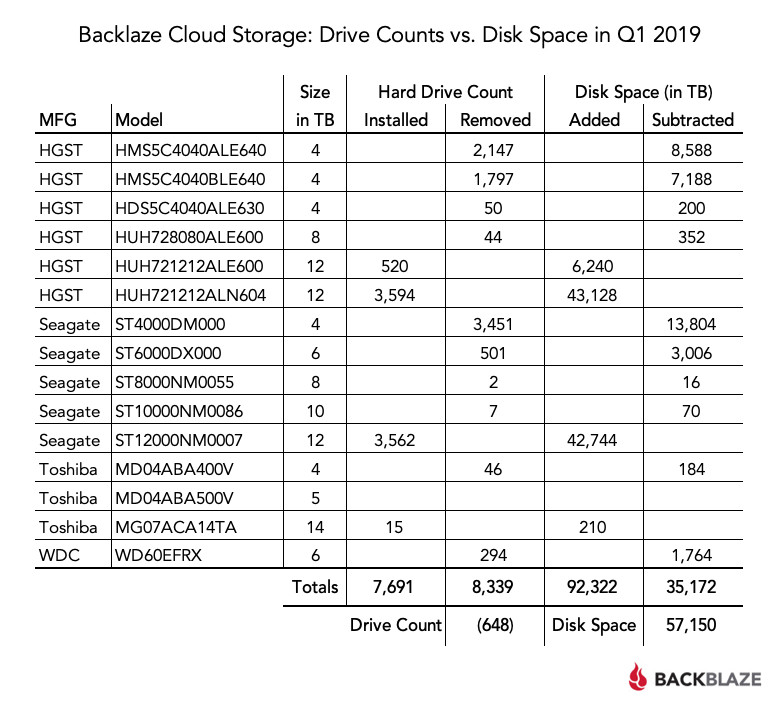
Fewer Drives = More Data
Those of you who follow our quarterly reports might have observed that the total number of hard drives in service decreased in Q1 by 648 drives compared to Q4 2018, yet we added nearly 60 petabytes of storage. You can see what changed in the chart below.
Lifetime Hard Drive Stats
The table below shows the lifetime failure rates for the hard drive models we had in service as of March 31, 2019. This is over the period beginning in April 2013 and ending March 31, 2019.