At the end of 2017 we had 93,240 spinning hard drives. Of that number, there were 1,935 boot drives and 91,305 data drives. This post looks at the hard drive statistics of the data drives we monitor. We’ll review the stats for Q4 2017, all of 2017, and the lifetime statistics for all of the drives Backblaze has used in our cloud storage data centers since we started keeping track.
Hard Drive Reliability Statistics for Q4 2017
At the end of Q4 2017 Backblaze was monitoring 91,305 hard drives used to store data. For our evaluation we remove from consideration those drives which were used for testing purposes and those drive models for which we did not have at least 45 drives (read why after the chart). This leaves us with 91,243 hard drives. The table below is for the period of Q4 2017.

A few things to remember when viewing this chart:
– The failure rate listed is for just Q4 2017. If a drive model has a failure rate of 0%, it means there were no drive failures of that model during Q4 2017.
– There were 62 drives (91,305 minus 91,243) that were not included in the list above because we did not have at least 45 of a given drive model. The most common reason we would have fewer than 45 drives of one model is that we needed to replace a failed drive and we had to purchase a different model as a replacement because the original model was no longer available. We use 45 drives of the same model as the minimum number to qualify for reporting quarterly, yearly, and lifetime drive statistics.
– Quarterly failure rates can be volatile, especially for models that have a small number of drives and/or a small number of drive days. For example, the Seagate 4 TB drive, model ST4000DM005, has a annualized failure rate of 29.08%, but that is based on only 1,255 drive days and 1 (one) drive failure.
– AFR stands for Annualized Failure Rate, which is the projected failure rate for a year based on the data from this quarter only.
Bulking Up and Adding On Storage
Looking back over 2017, we not only added new drives, we “bulked up” by swapping out functional and smaller 2, 3, and 4TB drives with larger 8, 10, and 12TB drives. The changes in drive quantity by quarter are shown in the chart below:
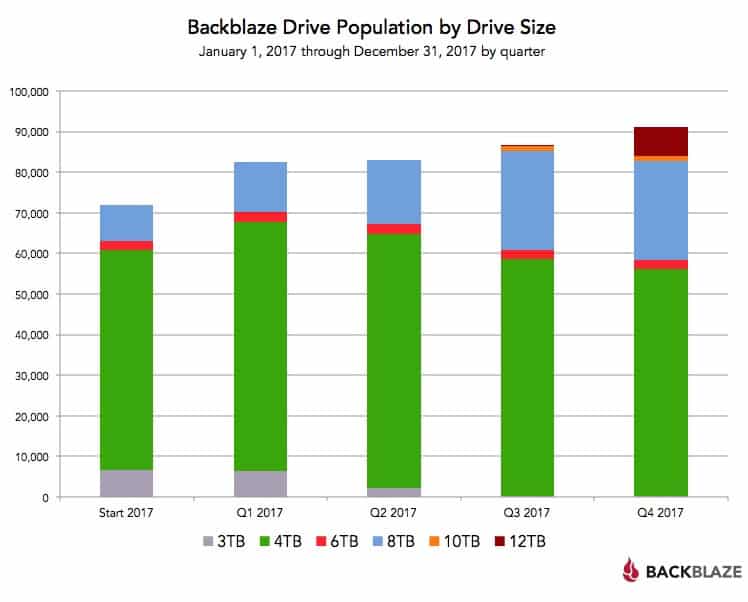
For 2017 we added 25,746 new drives, and lost 6,442 drives to retirement for a net of 19,304 drives. When you look at storage space, we added 230 petabytes and retired 19 petabytes, netting us an additional 211 petabytes of storage in our data center in 2017.
2017 Hard Drive Failure Stats
Below are the lifetime hard drive failure statistics for the hard drive models that were operational at the end of Q4 2017. As with the quarterly results above, we have removed any non-production drives and any models that had fewer than 45 drives.

The chart above gives us the lifetime view of the various drive models in our data center. The Q4 2017 chart at the beginning of the post gives us a snapshot of the most recent quarter of the same models.
Let’s take a look at the same models over time, in our case over the past 3 years (2015 through 2017), by looking at the annual failure rates for each of those years.
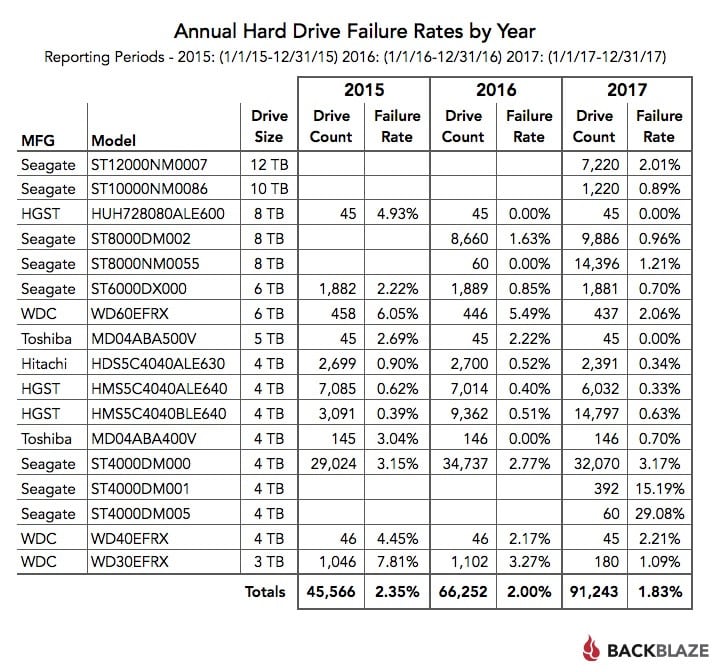
The failure rate for each year is calculated for just that year. In looking at the results the following observations can be made:
The failure rates for both of the 6 TB models, Seagate and WDC, have decreased over the years while the number of drives has stayed fairly consistent from year to year.
While it looks like the failure rates for the 3 TB WDC drives have also decreased, you’ll notice that we migrated out nearly 1,000 of these WDC drives in 2017. While the remaining 180 WDC 3 TB drives are performing very well, decreasing the data set that dramatically makes trend analysis suspect.
The Toshiba 5 TB model and the HGST 8 TB model had zero failures over the last year. That’s impressive, but with only 45 drives in use for each model, not statistically useful.
The HGST/Hitachi 4 TB models delivered sub 1.0% failure rates for each of the three years. Amazing.
A Few More Numbers
To save you countless hours of looking, we’ve culled through the data to uncover the following tidbits regarding our ever changing hard drive farm.
– 116,833 – The number of hard drives for which we have data from April 2013 through the end of December 2017. Currently there are 91,305 drives (data drives) in operation. This means 25,528 drives have either failed or been removed from service due for some other reason – typically migration.
– 29,844 – The number of hard drives that were installed in 2017. This includes new drives, migrations, and failure replacements.
– 81.76 – The number of hard drives that were installed each day in 2017. This includes new drives, migrations, and failure replacements.
– 95,638 – The number of drives installed since we started keeping records in April 2013 through the end of December 2017.
– 55.41 – The average number of hard drives installed per day from April 2013 to the end of December 2017. The installations can be new drives, migration replacements, or failure replacements.
– 1,508 – The number of hard drives that were replaced as failed in 2017.
– 4.13 – The average number of hard drives that have failed each day in 2017.
– 6,795 – The number of hard drives that have failed from April 2013 until the end of December 2017.
– 3.94 – The average number of hard drives that have failed each day from April 2013 until the end of December 2017.